Solibri Score and PowerBI
-
Hello everyone,
Recently we have received some questions regarding the data in Solibri Score and how it can be exported to tools such as PowerBI (example: https://society.solibri.com/topic/1375/new-score-functionality/2).
We would like to understand a bit more about how many of our users are using PowerBI, what is the nature of that usage and what could Solibri potentially offer in that sense. So if you use PowerBI, we would like you to answer the following questions:
- What type of data would you like to export from Solibri to PowerBI?
- If you are already exporting some data to PowerBI, how do you do it?
- Are there other tools apart from PowerBI that you are using and would like to export Solibri data to?
Thank you,
David and the Solibri team. -
As explained in the beta subforum the score does not really give us an unbiased overview. Therefore we are utilizing information of different reports at the moment to combine information from Coordination Reports, Checking Report, ITOs and the API. However this can be a bit cumbersome as well as the relationships can only be created if some things are considered. Without going now to much into the details the most important information needed to get an overview are Total Components, Checked vs Unchecked Components, Total Issues by Category, Total Issues by Component, Passed and Failed Components, Cleaned Numbers (excluding Gatekeepers) … For a more detailed evaluation meta information about the rules would be nice too. Also the possibility of utilization of the information in the Issue tab e.g. for ITOs would be great relief so that all related component information (Entity, Discipline, Model, …) as well as the related issues (on element basis!) they have could be harvested directly from there combined in one report. (btw the listed issues there show already the rule they are coming from!) To sum it up, it would be great if in the near future there is only one source which satisfies all the needed and desired information to create.
-
on our side, we are currently developing and choosing which data we are going to use for our BI setup. So far we have been exporting xslx files from our authoring tools, which so far works fine. A live connection would be off course much better since it saves time. We are currently working on other solutions to feed data in a cleaner and reliable way that involves 3rd party apps.
An important aspect about this topic is, that the market does not offer only Power BI, which is a Microsoft product. There are tons of other products such as Tableau, looker, google datalab, sisense and also from the open source community such as: LinceBI (our favorite), spagoBI, redash. Some even offer better options than PowerBI. Therefore, it would be nice if Solibri could offer its analytics not just to PowerBI. There is more out there, than just Microsoft")
Since we are designer & engineers working on a virtual building, it is necessary to visualize the building. Additional to the diagrams and pie charts, an interactive model would be more than appreciated. There are already some solutions on the market such as Vcad and some from “proving grounds”. This way the user could inspect the data inside the model and get a better overview. Like this:
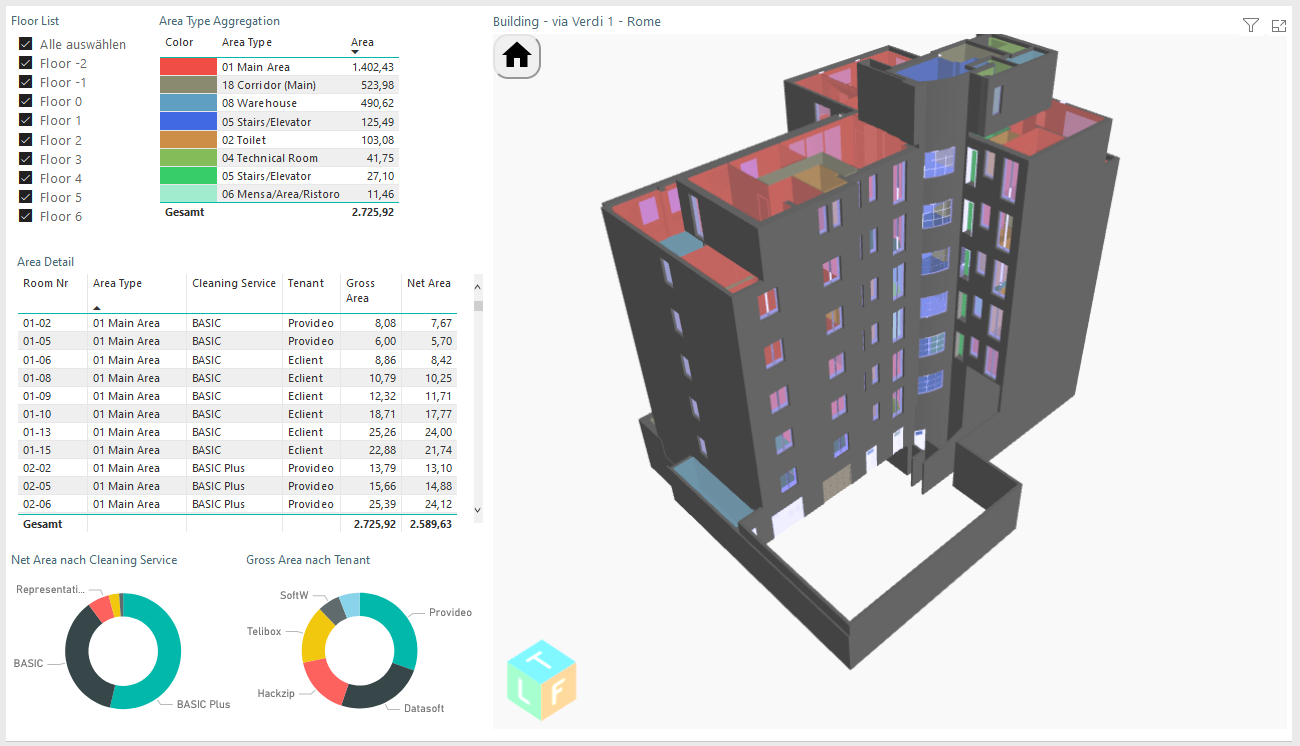
Options that we would use from Solibri in the BI setting would be the classifications. In this scenario, we would get a better visual overview (including the 3D Model) of which elements have fulfilled the criteria (the same way in solibri).
To also get a better understanding of the project development and its KPIs, the TIME factor is important. In this use case, the time stamp of a model would allow the BI to show the improvement, hence the BI should store the specified time. This can be currently easily accomplished by a spreadsheet table. Only in this way we can visualize and get better data understanding if the model is progressing or not.Everything else has been already mentioned in the previous post.
Copyright © 2025 Solibri Inc. | Powered by NodeBB