Making sense out of reports
-
Hi everyone,
I have been using the checking reports (xlsx) as an overview about the number of checked components, failed or approved… but just for personal orientation.
Now I have started to implement these as official reports to our quality checks. But somehow I cannot build a comprehensible understanding of these numbers.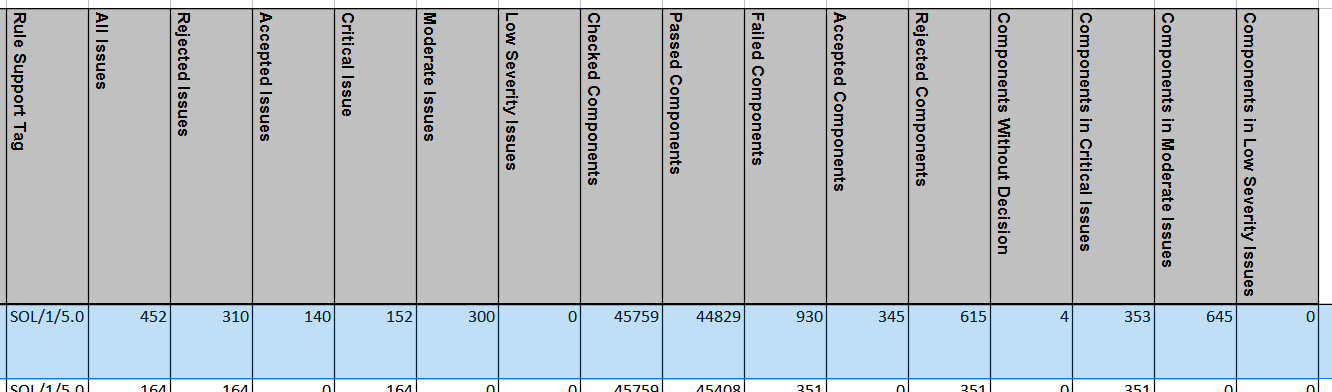
My plan is to create a development status of LOIN requirements based on percentage. If a certain Rule has no issues, then it is 100% complete. If there are issues, then the percentage should vary depending on the severity of problems. In this step my problem arises!
I have tried checking the “All Issues” against “Rejected Issues”, but it does not bring me a definitive result, since I am dealing here with only reported errors. In this case, the 310 would be 68,5% of rejected issues from all issues. This percentage does not declare the overall state of the model.
On the other hand, calculating the “Checked Components” against “Failed Components” will bring me mostly results around 98% or 99%, since the total number of components of that model is always huge compared to the failed ones. So this percentage is also not very reliable about the status of the model.I hope I am making myself clear…
Does anyone have maybe workflow suggestions how to track the development of models with these reports?
-
This report is indeed a bit ambivalent. Tbh atm there is no real “out of the box” workflow which would satisfy the needs I guess, altough it wouldn’t be so hard to implement it either I guess. As we are working on a comprehensive dashboard to visualize the model status based on checking results since a while I have to say that without further customization it is not easy to reflect the overall situation in a smart way - not within just one report. Escpecially not with the summary report which is rule based and not element based. E.g. first you would need to break down your rules by entity to have a better chance of differentiation - which is cumbersome and of course does not deal with all the conceptual obstacles.
Will leave the other topics here as well to bring attention to them.
https://society.solibri.com/topic/1473/interpreting-the-checking-summary-report-stats/8?=1629298267451
https://society.solibri.com/topic/1399/solibri-score-and-powerbi/3
https://society.solibri.com/topic/1485/customview-get-checked-components-of-a-rule/6?=1629299026745
… -
@JSN I assume you are integrating these values in powerBI. I am also thinking about it, but because of the complexity, or better to say uncomprehensibility of these values, I find it hard to community the results in a meaningful way. Can you share anything in which direction you are aiming?
Maybe the @Solibrians have a guideline on how to actually use the potential of these reports? Since it has been developed, I assume there must be some reason behind if.
AllesWirdGut Architecture
www.awg.at -
@agroni said in Making sense out of reports:
I find it hard to community the results in a meaningful way
Absolutely and unfortunately the mentioned shortcomings require to have either a very streamlined and diciplined workflow, or lots of customization (where the API is quite helpful here though) done. Actually tbh the limitations currently kind of require both and this is a bit a show-stopper.
To give you a glimpse where we are heading to - and as it hopefully triggers an open discussion about improving the Solibri Reports - I will leave some thoughts here:
-
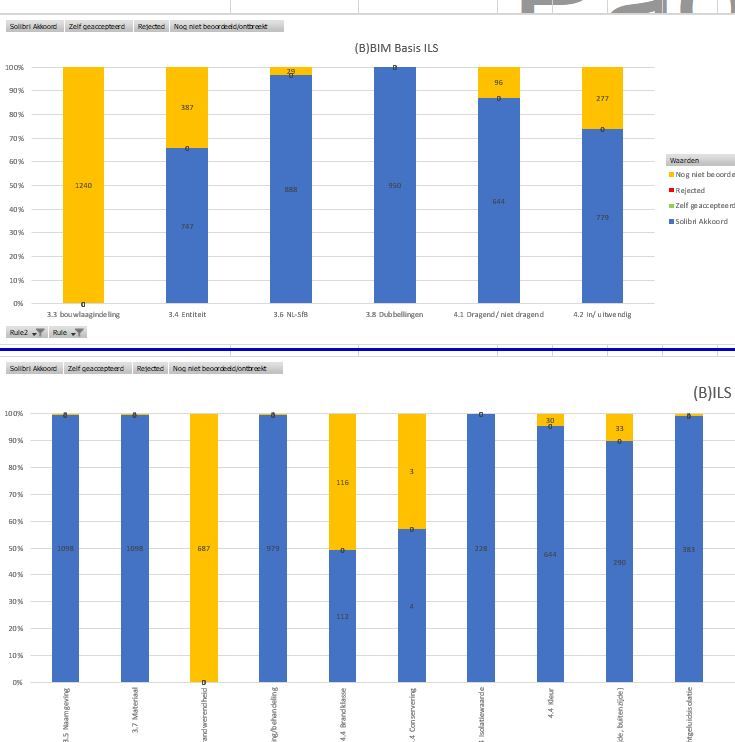
So first of all there is this one thing that it is very important to have a good overview about the different disciplines an the required Level of Information. The more breakdowns you achieve, the easier it is to understand if the quality is on target.
-
Unfortunately it is currently not possible to e.g. track down the “Unchecked Components” in an easy way and as I mentioned previously if you want to have a wide range of related information than you have to obey way too much things an ordinary user should not really care about as it counteracts the principle of usability.
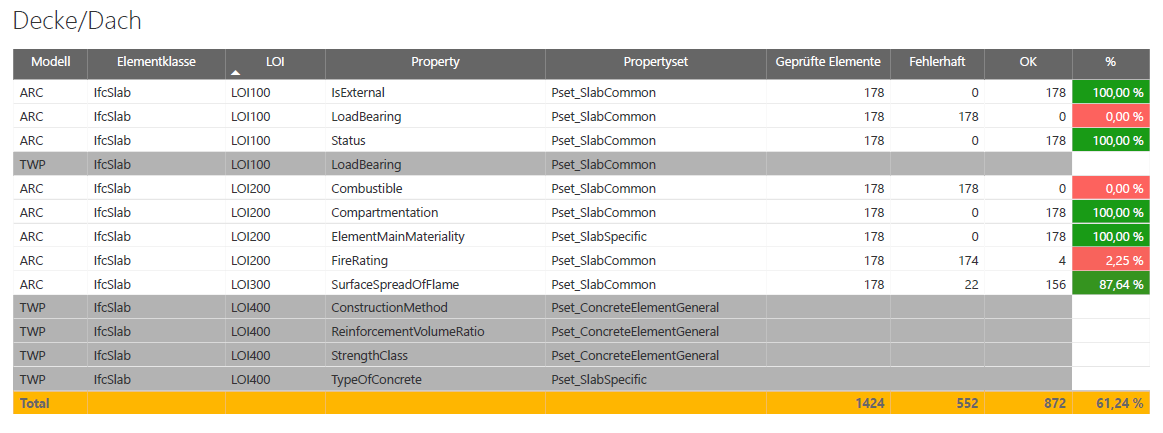
- Then it is of course desirable to have a deeper insight e.g. to have a good visual understanding of the, as you called it I think, detailed “development status” of the defined LOI. Again, this is also not really achievebale without developing a workflow on your own and not just me but also others have already pointed out that Solibri lacks a bit in the forum here.
So to sum it up, due to the limitations and the way how data is structured we currently get from Solibri, the whole adventure is very fast becoming a hybrid data monster nothing which comes closed to an optimized workflow as there are lot of dependencies and custom solutions involved. Nevertheless I hope that with the ongoing developements, updates and more precise specifications of needs from the users, these things are put on the agenda.
-
-
@JSN
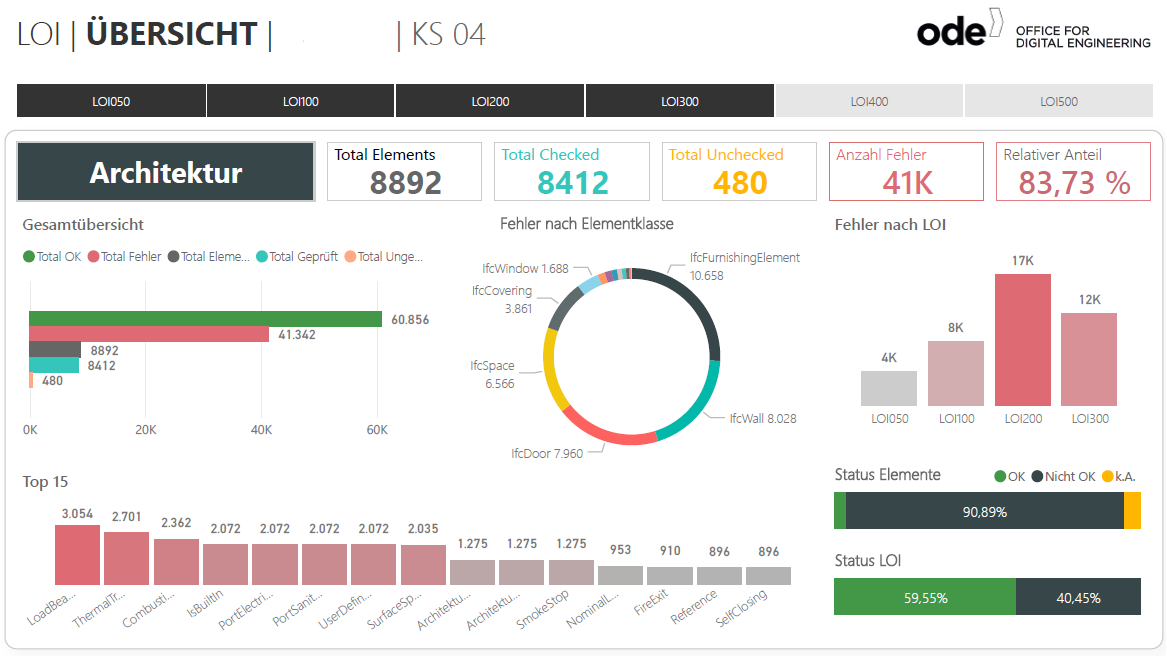
That is an impressive power BI report. I am working on the same report but still a lot to accomplish what you have done here.But coming back to the logic of these values from Solibri, in your report you have 41 thousand errors in the architecture model. When the investor sees this number, won’t he fall out of his chair? More sense makes the percentage of the element status that you have below. But on the other hand the “Total OK” number of components (green bar on the left) does not fit the story.
Please don’t understand this, that I want to critisize your report or whatsoever. I just find personaly there should be a more comprehensible report from Solibri to make sense out of our reports. This is actually the subject that I am struggling to unwind in my report (currently under construction).So maybe @Solibrians could jump in and give their part to this discussion. How could we improve the data, to get a more comprehensible numbers. What could we add? what could be calculated differently? I think there is some potential for improvement…
p.s. when I am ready with my report, I will also share it
")
-
@agroni said in Making sense out of reports:
Please don’t understand this, that I want to critisize your report or whatsoever. I just find personaly there should be a more comprehensible report from Solibri to make sense out of our reports. This is actually the subject that I am struggling to unwind in my report (currently under construction).
Absolutely, the main reason why we (and as we see here also you and others) started to work independently on this topic is because currently it is very hard to quickly communicate the overall status of a model with the given possibilities. The latest developments on this field aka Solibri Score is not making this any better as it does not really explain the results - there is no transparency and partly it is not meaningful at all which could easily lead to misinformation or even to the outlined chairfall.
But coming back to the logic of these values from Solibri, in your report you have 41 thousand errors in the architecture model. When the investor sees this number, won’t he fall out of his chair? More sense makes the percentage of the element status that you have below. But on the other hand the “Total OK” number of components (green bar on the left) does not fit the story.
The amount of errors is due to the fact that only about 60% of the desired information have been included, which on the other side also explains the why just about 10% of the elements are satisfiyng the needs. I agree the labeling is maybe not clear enough or even a bit misleading but if that would be our biggest problem then I would be more than happy
So maybe @Solibrians could jump in and give their part to this discussion. How could we improve the data, to get a more comprehensible numbers. What could we add? what could be calculated differently? I think there is some potential for improvement…
In different topics and inquiries there have already been a few attempts to start the discussion but the interesst was rather modest.
-
The reports form solibri i imported them as a query in a other exel sheet.
With some fomula we make a good dasboard of it with a pivot table1 issues can contain a lot of failed components.
So we used te Checked/passed/failed/accepted componets to make the dasboard
Copyright © 2025 Solibri Inc. | Powered by NodeBB